Jump to Section
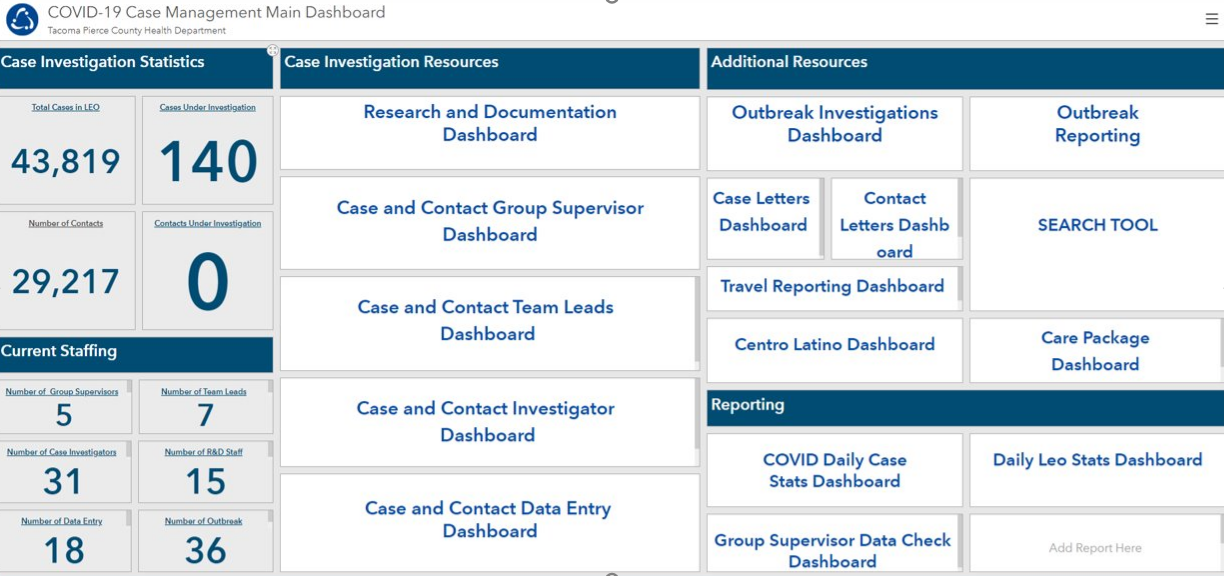
Public Health
With my GIS and epidemiologist coworkers, I maintained and built dashboards, web maps, and web apps that fed into this COVID case and contact management system. At the peak of COVID response, more than 150 staff members used this system.
Local Parks and Utilities
Park Features Viewer
I created this app for park staff so they could explore park amenities and infrastructure (fences, gates, baseball fields, picnic tables, trails, etc.). My coworkers and I collected park amenity data in the field using Collector for ArcGIS. We also input some amenity data into GIS data using as-builts and drone imagery.
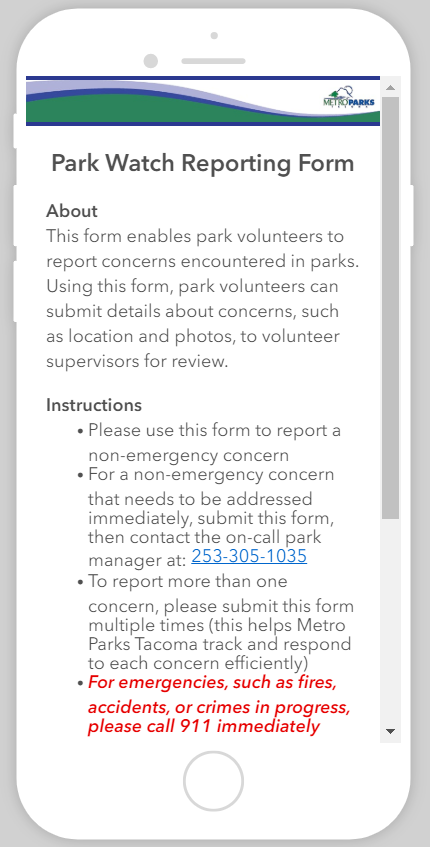
Park Watch Reporting App
I built this using Esri’s Survey123 tool. It allows park volunteers to submit information about park concerns (e.g. broken benches, downed trees). When volunteers submit information, supervisors receive email notifications (thanks, Microsoft Flow!) and can track the concerns on a dashboard.
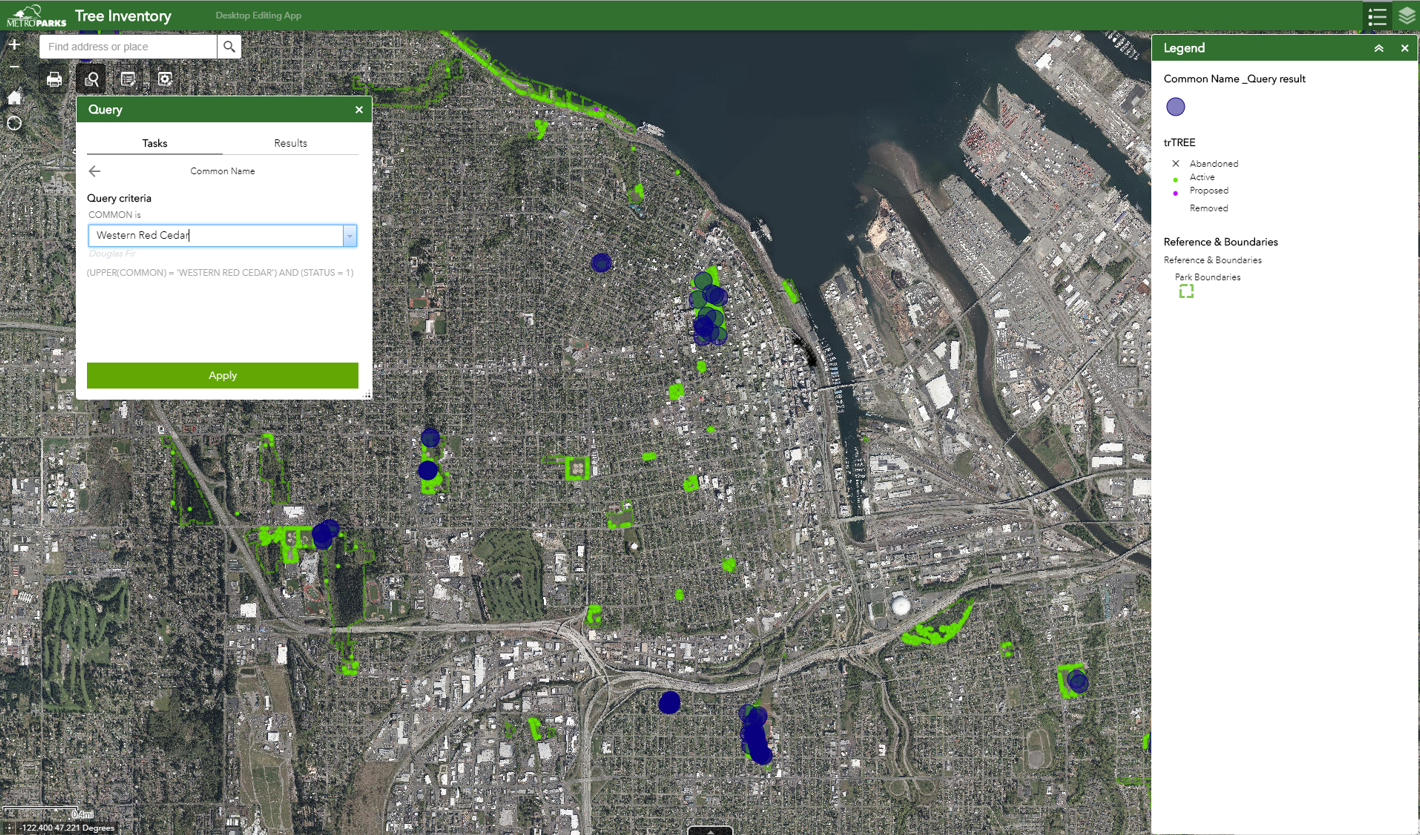
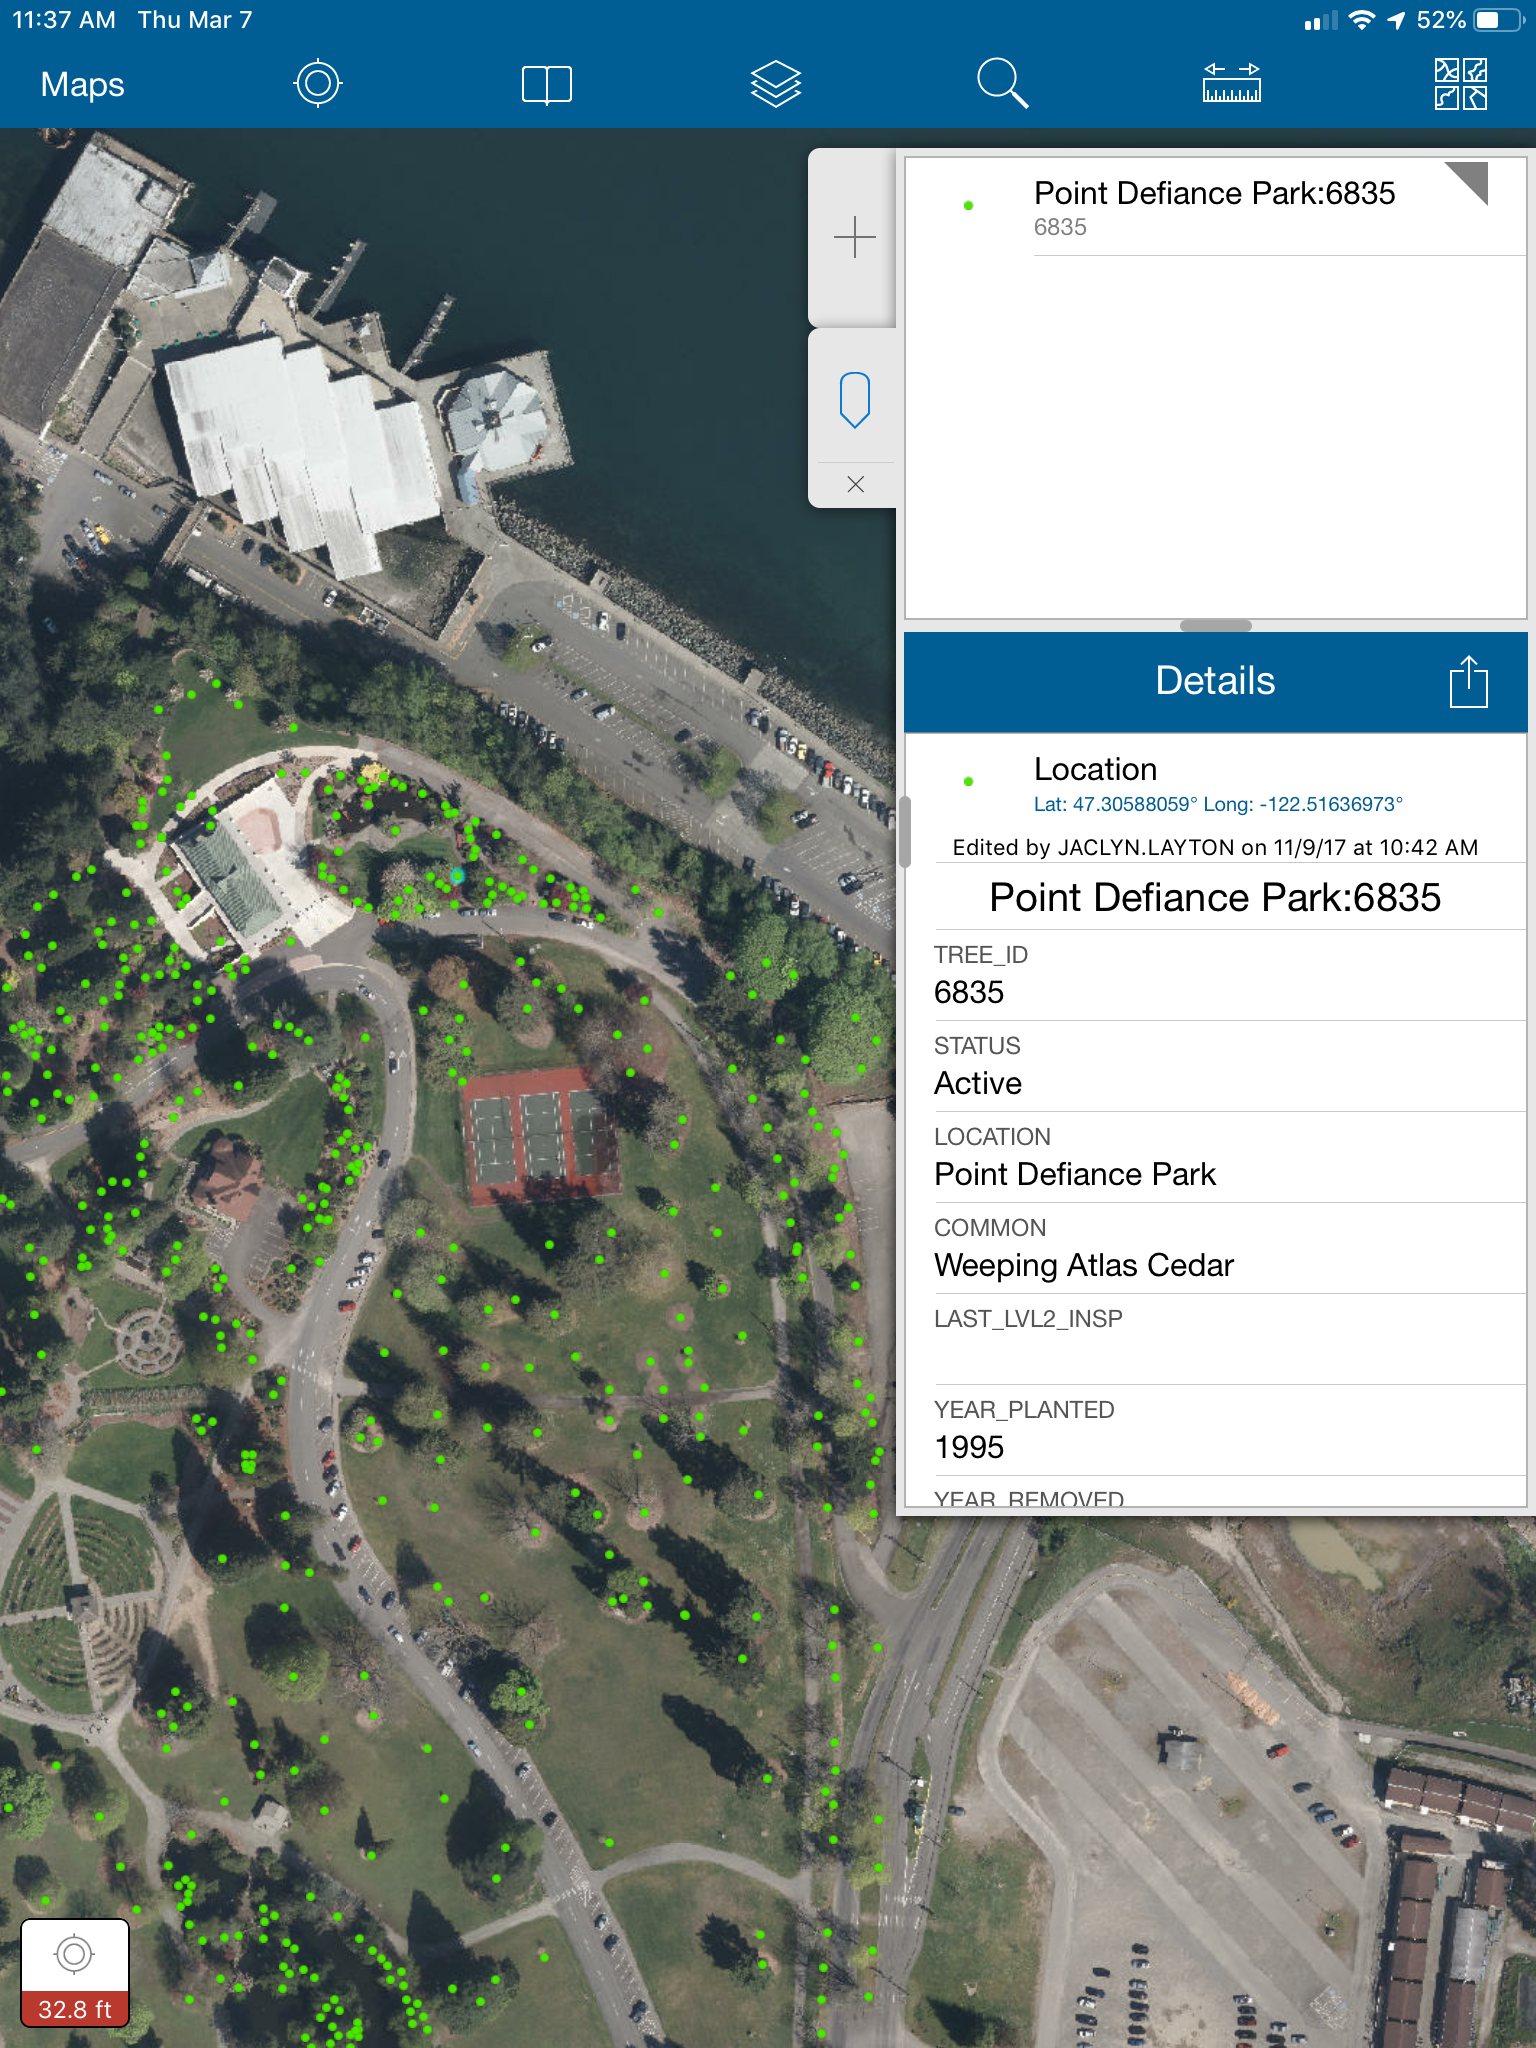
Tree Inventory App
This app provided urban forestry staff with an easy way to batch edit tree information. Staff could select all trees meeting certain criteria and update information about those trees with a few clicks.
Mobile Tree Data Collection App
I maintained this mobile tool that allowed forestry staff to track trees, inspections, and simple work orders.
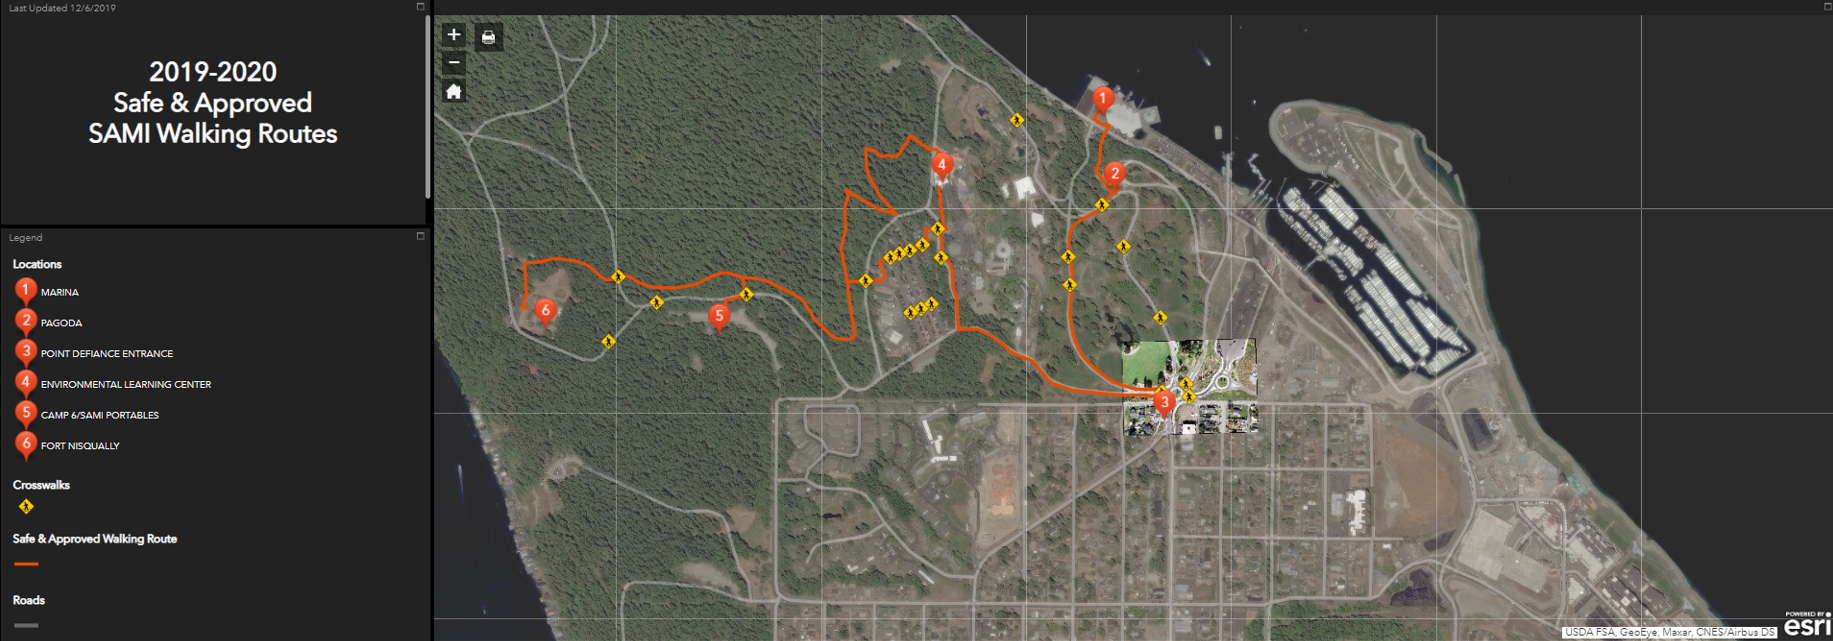
Safe Walking Routes Map
I designed this web map to show suggested walking routes for SAMI students. SAMI is a Science and Math Institute located within a large park. Part of the part had recently been redeveloped, so I brought in imagery of the redeveloped area so roads and sidewalks would be up-to-date.
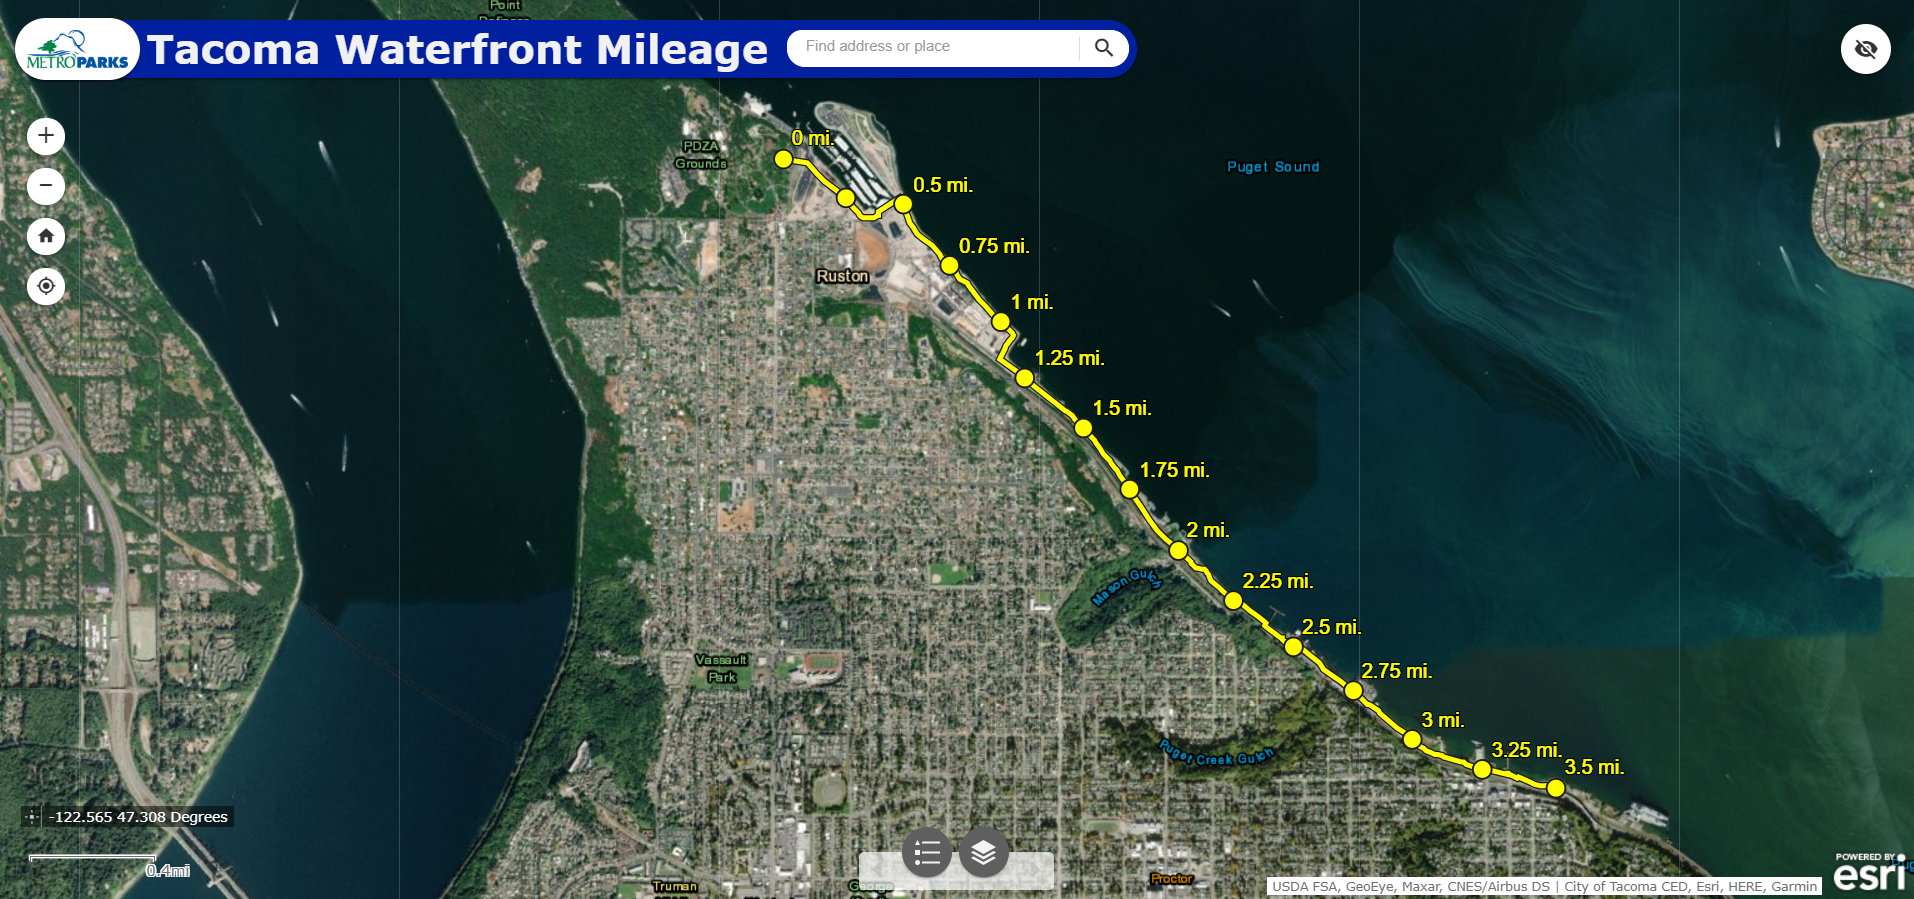
Waterfront Mileage Map
This web map just shows mileage along a trail system.
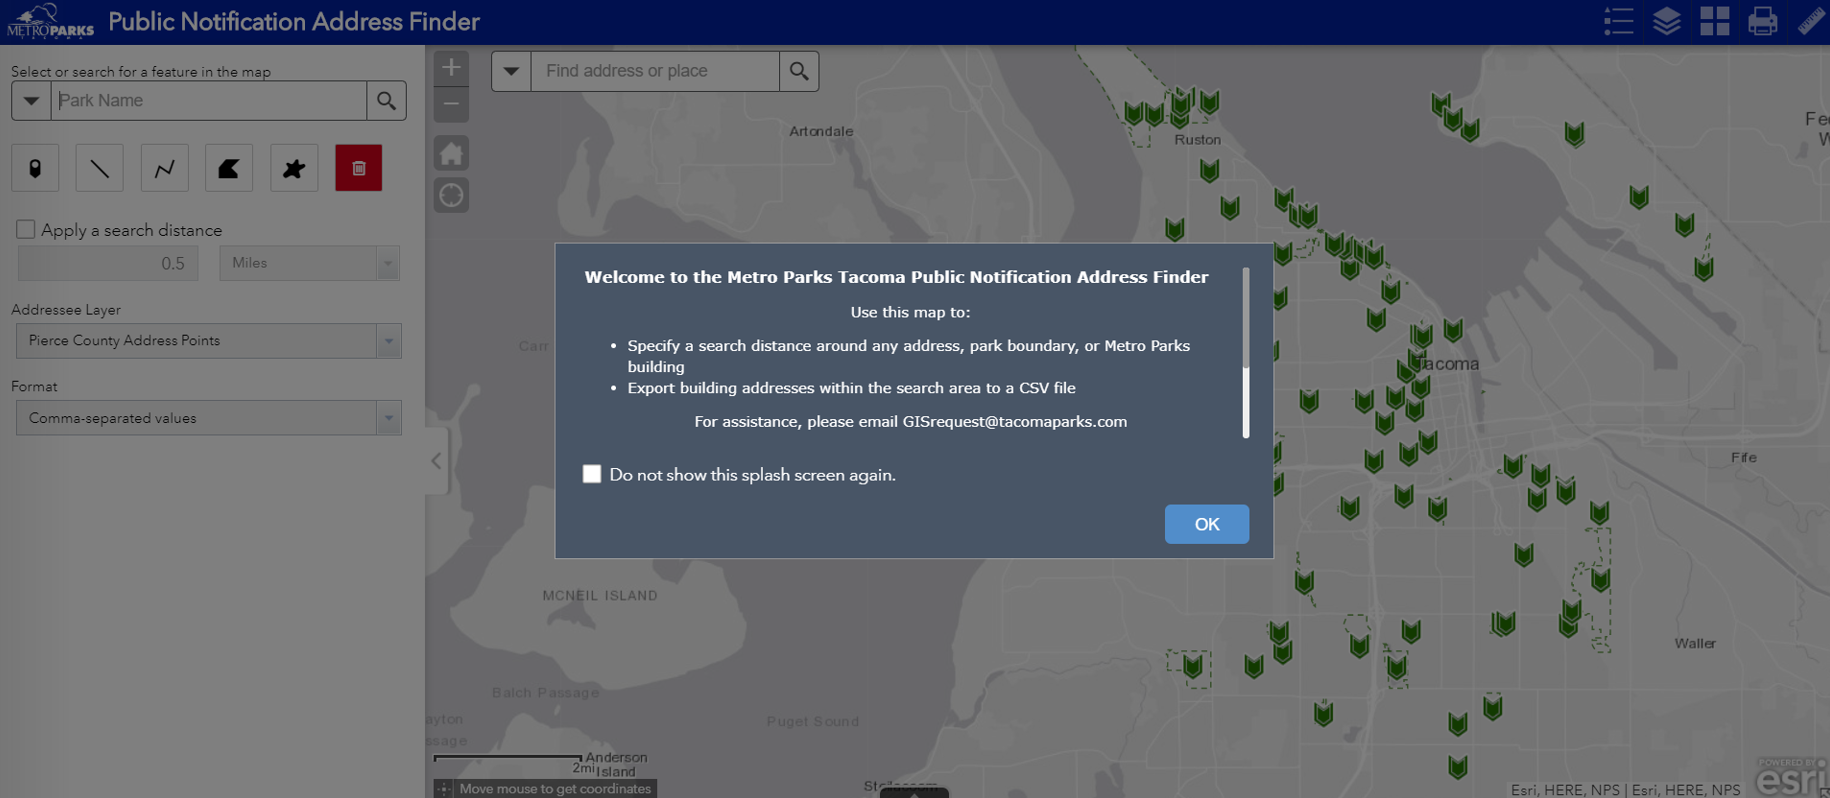
Public Notification Address Finder
I created this app to provide park planning staff with an easy way to export a list of addresses within a certain distance of parks or buildings. The address lists were used to create mailers for public meetings.
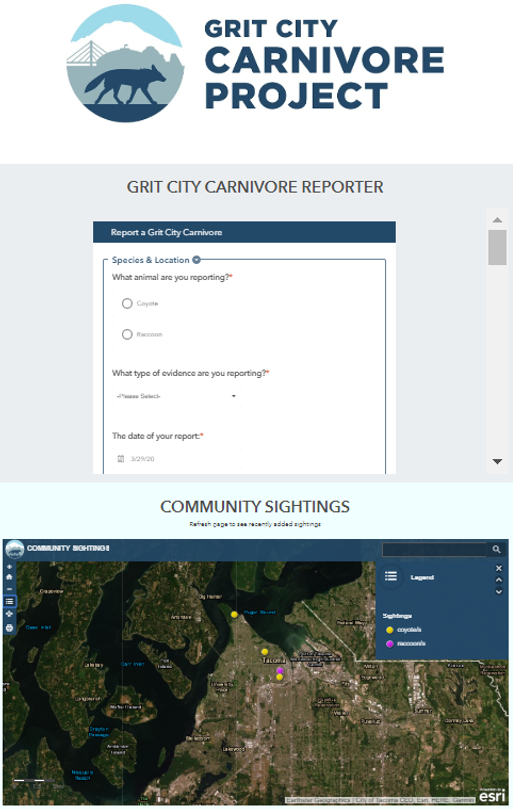
Coyote/Raccoon Spotter
Based on a request from zoo staff members, I used ArcGIS Online to collect carnivore sighting data from the public. This tool used both Survey123 for ArcGIS and ArcGIS Hub. (Note: I can’t take credit for the cool coyote logo.)
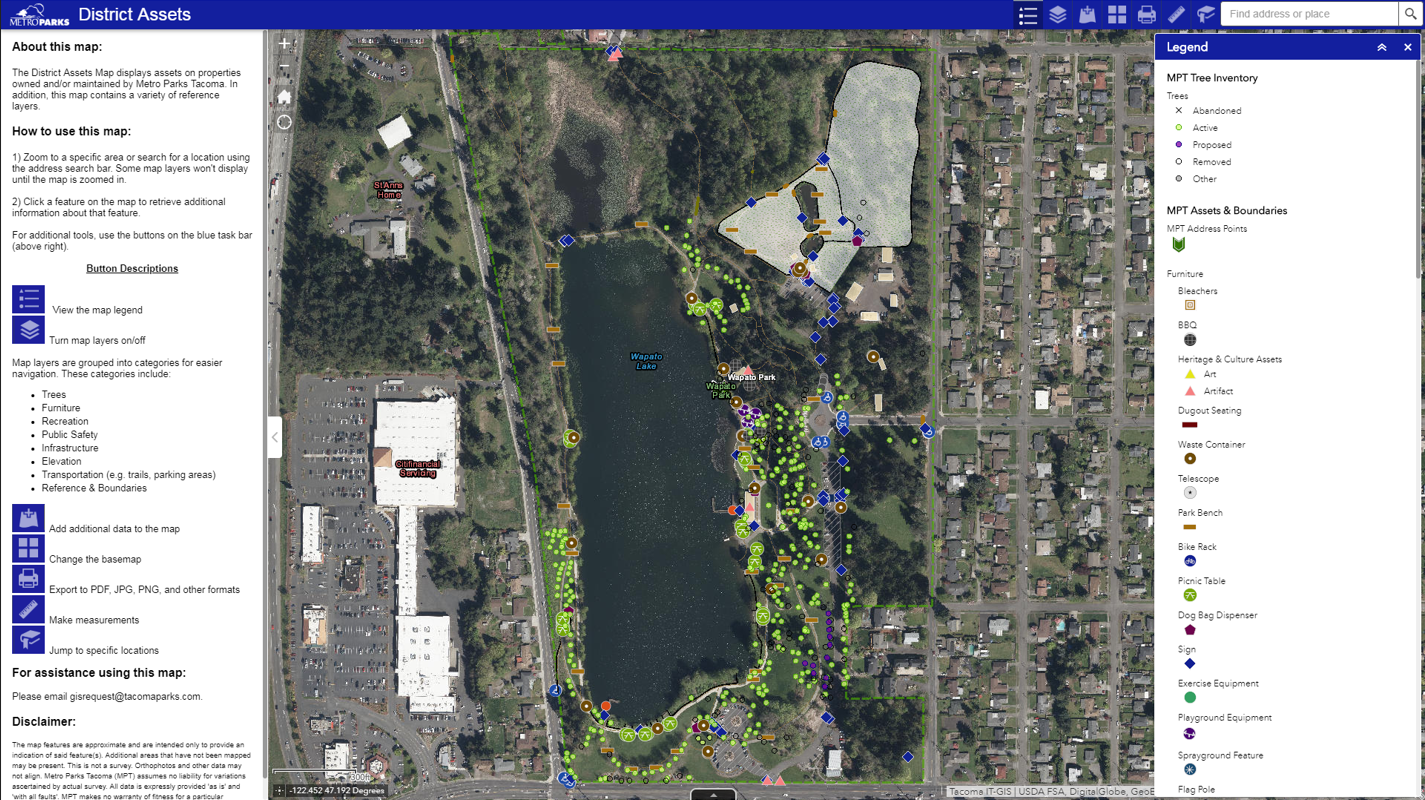
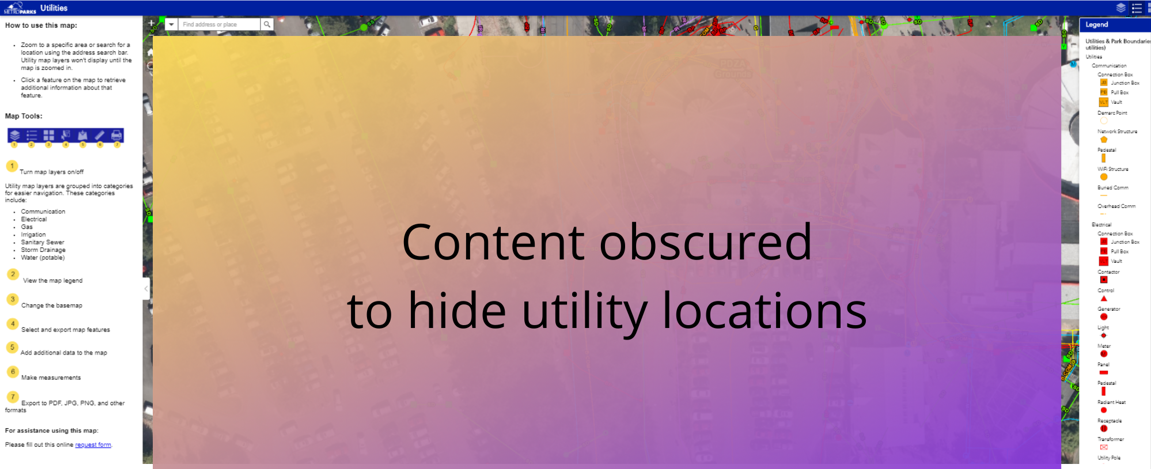
Park Utility Viewer
I created this app for park operations and maintenance staff. It was the result of years of work collecting, scanning, and georeferencing as-builts, importing CAD data, digitizing utilities, and conducting utility field checks.
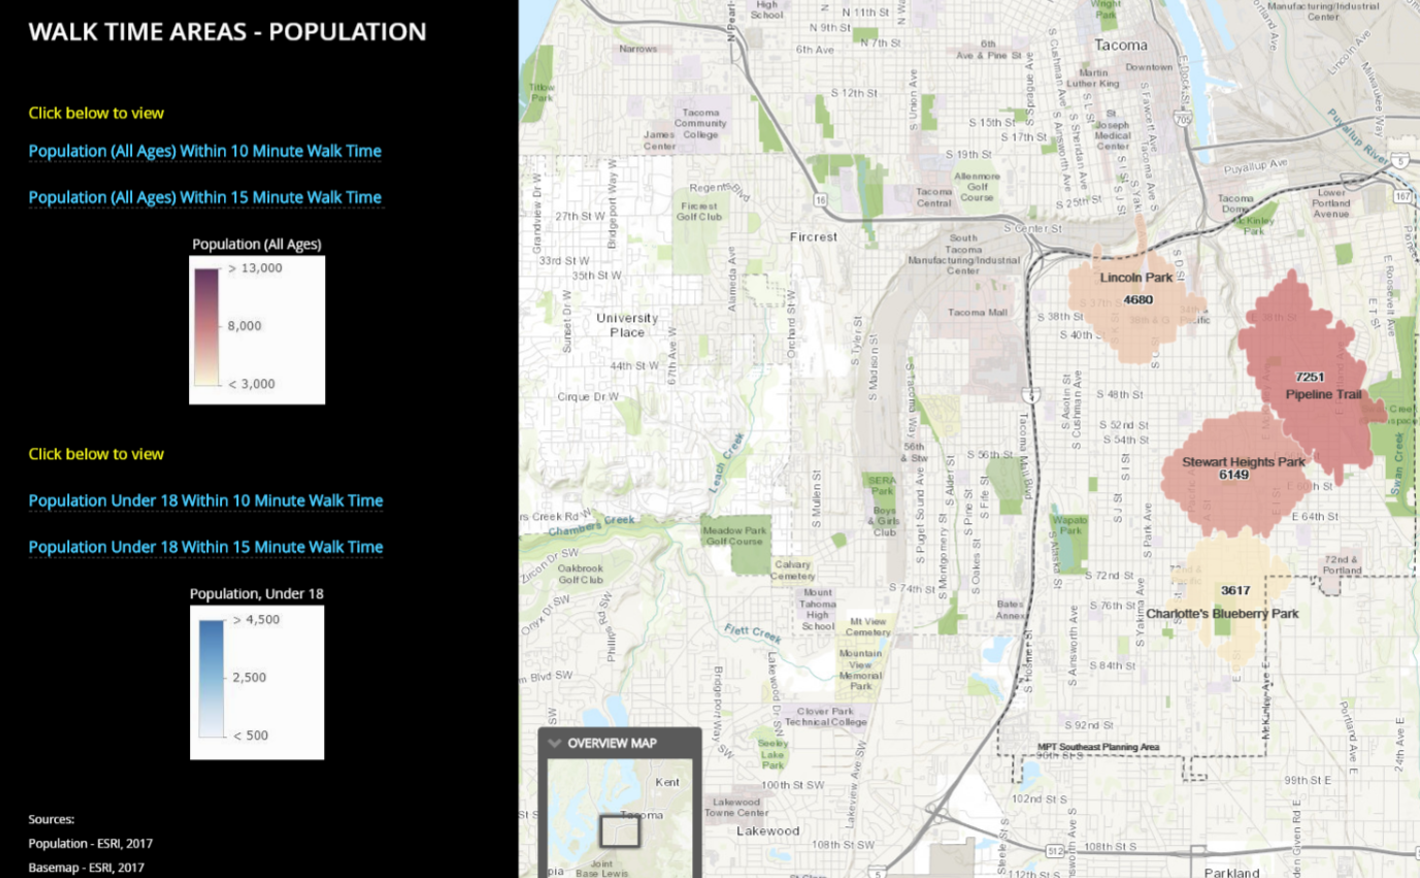
Park Walk Time Explorer
I made this Esri Story Map to visualize areas within 10 and 15 minute walks from Tacoma parks. (This was created prior to the City of Tacoma’s involvement in the Trust for Public Land’s fantastic Park Score analysis.)
>
Parks Department GIS Portal
Working alongside my GIS colleagues, IT staff, and an ESRI advisor, I implemented Portal for ArcGIS on Microsoft Azure. After Portal was stood up, we created various tools for park staff and made them accessible via ArcGIS Enterprise Sites.
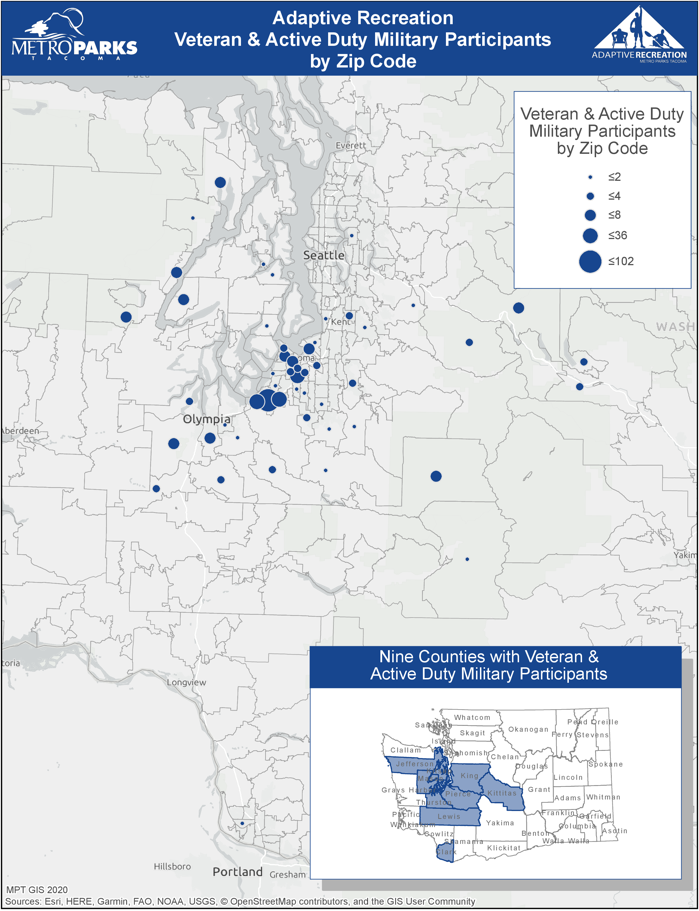
Adaptive Recreation Participants Map
This map shows veteran/active duty adaptive recreation program participants.
Simple Mapbox Webmap
This is a very, very simple web map I built for fun. It uses Mapbox GL JS and shows the location, name, and address of Metro Parks Tacoma properties. I’ve always used Esri tools to create maps, so I wanted to try something different. I still need to style the pop-ups and work on other map improvements. I look forward to learning more about Mapbox’s capabilities.
To view the map, click here.
National Parks
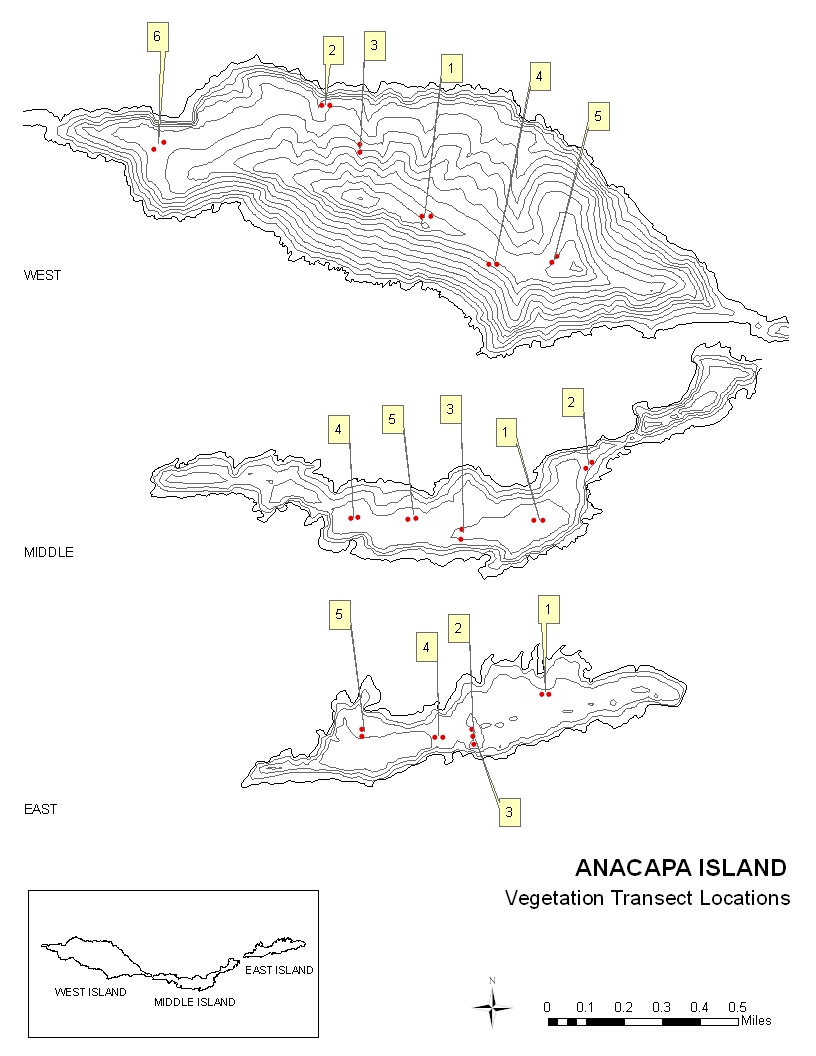
Anacapa Island Vegetation Transects Map
I made this (rather old-fashioned looking!) map many years ago as an intern with Channel Islands National Park. It’s not my best design work, but it provided the information the biologists wanted to see.
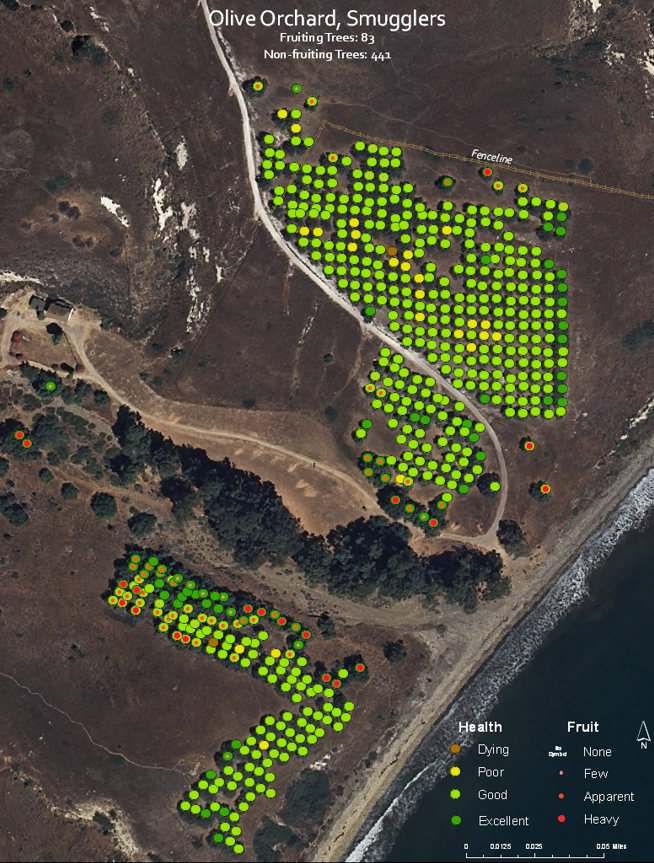
Orchard Tree Health Map
As an intern with Channel Islands National Park, I collected tree data at Smuggler’s Cove and used it to create the following map. This old map is also not my best design work, but it was used internally and didn’t need to be beautiful.
GIS Analysis for Prisoners Harbor Environmental Impact Statement
As an intern with Channel Islands National Park, I used GIS to aid in vegetation planning for a fill disposal site on Santa Cruz Island.
Please see Appendix C in this PDF.
For Fun
Mexico City Building Heights Map
I played around with some symbology settings in Mapbox to show building heights along Mexico City’s Paseo de la Reforma. (Unfortunately, there appear to be a lot of building polygons missing in this area.)
Roller Skating Rinks in Metro Atlanta Map
This is another very, very simple web map I built for fun. It uses Leaflet and Open Street Map to display a few roller rink locations in the Atlanta area. I built it purely as a learning experience. I’ve primarily worked with Esri products, so I wanted to learn more about open source mapping options.
Return to top